Tell Us About Your Project

Your Global Investment Compass for Theme Park Attractions: Actionable insights and a clear market analysis designed for theme parks, museums, FECs, and experiential commercial venues worldwide.
Fast ROI Insight
Data-Backed Payback Cycles. ROI projections based on real installations across global markets.
Global Market Experience
Region-Specific Execution. Hands-on experience across North America, Europe, Southeast Asia, and Australia.
Certified, Long-Life Systems
Engineered for 10+ Years. International standards, all-climate reliability, and operational stability.
Scalable Investment Models
From Pilot to Landmark. Solutions tailored for both small installations and large-scale destination projects.
All regional executions are delivered through Sanhe’s integrated system: design validation → in-house manufacturing → compliance engineering → global installation.

Global Theme Park Attractions Investment Matrix
How to Use This Investment Matrix
Quickly compare investment thresholds, ROI cycles, and strategic value across regions to identify where animatronic assets best match your budget, risk tolerance, and operational goals. Data based on structured industry samples from 2024–2025.
| Dimension | North America | Europe | Southeast Asia | Middle East | South America | Australia / Oceania |
|---|---|---|---|---|---|---|
| Strategic Importance | Established & Profitable | Established & Profitable | High Potential, Low Penetration | Emerging, Volatile, High Reward | Emerging, Volatile, High Reward | Stable, Experience-Driven |
| Market Scale | 500+ theme parks, 4,000+ FECs (IAAPA) | 200+ cultural theme parks, 3,000+ museums (UNWTO) | Annual visitors >500M, tourism growth ~15% (Euromonitor) | Large government-driven projects | Local parks upgrading steadily | Strong wildlife parks & museum networks; stable annual visitor volume |
| Consumer Insight | Willing to pay for immersive experiences | Values cultural accuracy & sustainability | Social-media driven “check-in” attractions | Seek landmark-scale visual spectacles | Emphasis on durability & long-term value | High demand for realism, safety & educational value |
| Small-Scale Investment (3–8 creatures) | $30,000–$100,000 | €20,000–€80,000 | $10,000–$35,000 | $50,000–$150,000 | $15,000–$50,000 | AU$30,000–AU$80,000 |
| Large-Scale Investment (15+ creatures) | $150,000–$250,000 | €100,000–€200,000 | $40,000–$150,000 | $300,000–$600,000 | $70,000–$220,000 | AU$120,000–AU$250,000 |
| Small-Scale ROI Cycle | 3–10 months | 4–12 months | 3–9 months | 5–15 months | 5–12 months | 4–12 months |
| Large-Scale ROI Cycle | 18–36 months | 20–36 months | 12–30 months | 30–60 months | 18–30 months | 24–40 months |
| Our Delivery Focus | ROI validation + full compliance | Cultural accuracy + EU certifications | Rapid deployment + high shareability | Structural reinforcement + weatherproof tech | Durable materials + flexible financial plans | Safety-first engineering + UV-resistant materials |
Regional Deep-Dive & ROI Models
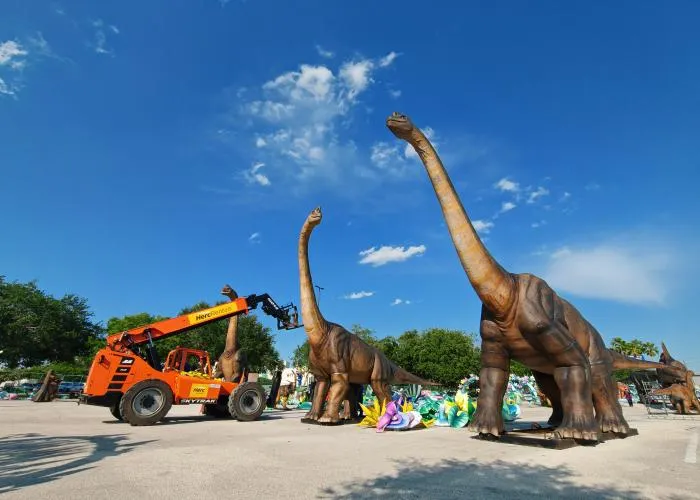
🇺🇸 North America — Data-Driven Growth
Revenue Potential
Ticket premiums + non-ticket spending inside theme park attractions (~15% per visitor…)
Execution
ASTM / OSHA / UL compliant; durable all-weather engineering.
As an experienced custom animatronics manufacturer, we ensure all our theme park attractions deliver turnkey success for complex, compliance-heavy global projects.
Decision Fit
✔ Established theme parks & museums seeking compliance-driven, stable returns
✖ Low-budget or temporary pop-up projects
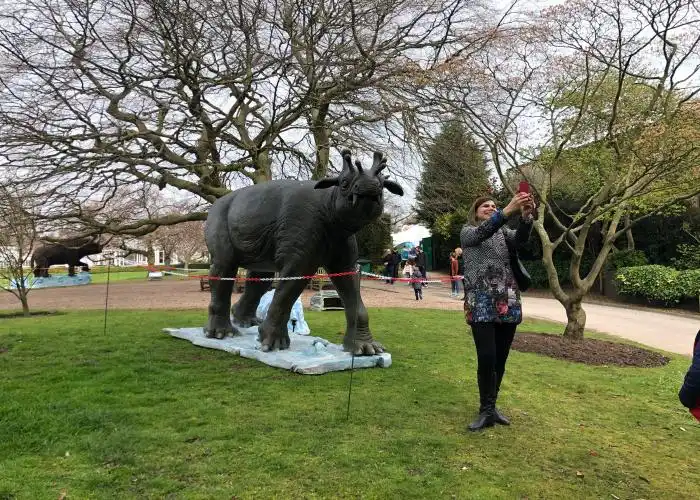
🇪🇺 Europe — Cultural & Compliance Focus
Revenue Potential
Long-term brand asset creation; regulatory-aligned operations
Execution
CE/EN compliance; collaborations with paleontologists ensure precision.
Manufactured and validated through our integrated manufacturing base, ensuring certification readiness from design stage.
Decision Fit
✔ Cultural institutions, science museums, and heritage-linked theme park attractions
✖ Short-turn, trend-driven attractions
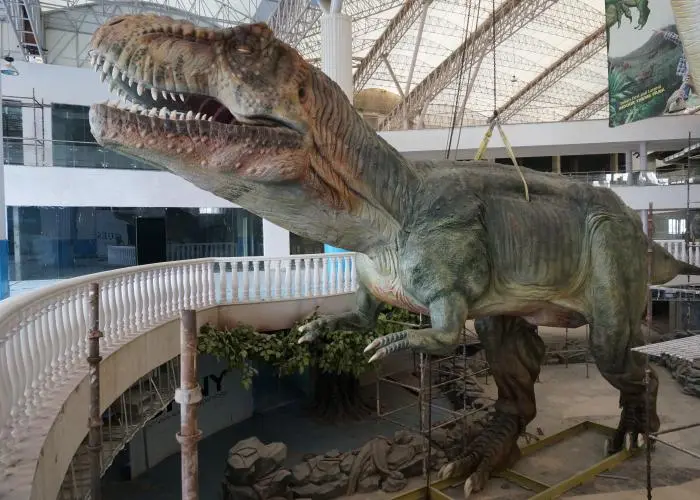
🌏 Southeast Asia — Fast Deployment, Social Appeal
Revenue Potential
Social-media-friendly experiences drive visitor engagement
Execution
Rapid design-to-deployment (~30 days); environment-adapted engineering.
Highly flexible concepts enabled by our custom animatronics development workflow.
Decision Fit
✔ Malls, pop-ups, and new attractions seeking fast ROI
✖ Ultra-high durability-only or slow-approval public projects
🇦🇺 Australia / Oceania — Safety & Experience
Revenue Potential
Stable attraction types (wildlife parks, museums); compliance-driven reliability
Execution
Safety-first engineering; UV and climate-resistant design
Decision Fit
✔ Long-term, safety-conscious installations
✖ Short-term promotions
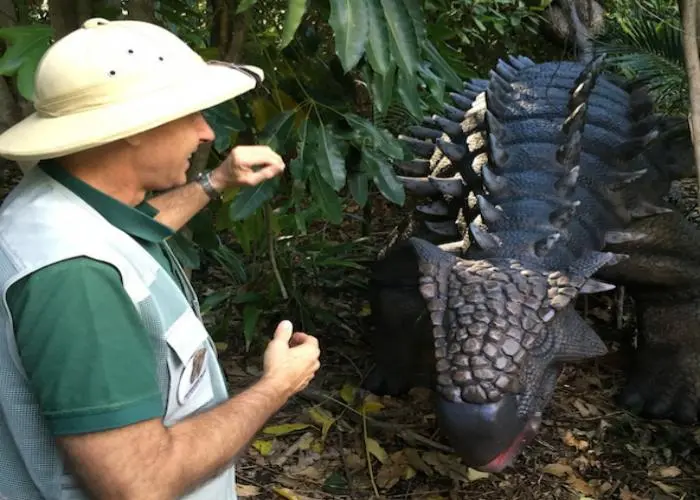
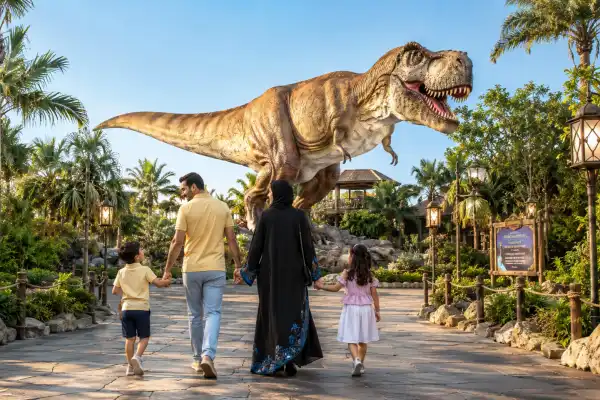
🇦🇪 Middle East — Landmark Installations
Revenue Potential
Iconic landmark attractions; city branding potential
Execution
Weatherproof systems; full-chain technical support
Decision Fit
✔ Landmark-scale, high-investment projects
✖ Small, low-visibility installations
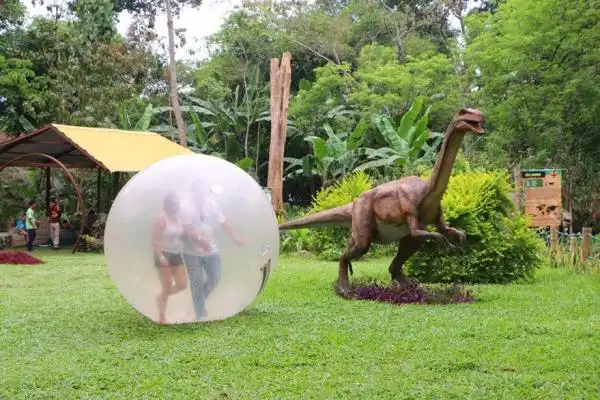
🇧🇷 South America — Durable & Flexible
Revenue Potential
Cost-conscious upgrades; low-maintenance operations
Execution
Durable structures; modular engineering
Decision Fit
✔ Phased investment and operationally sensitive parks
✖ High-maintenance, interaction-heavy systems
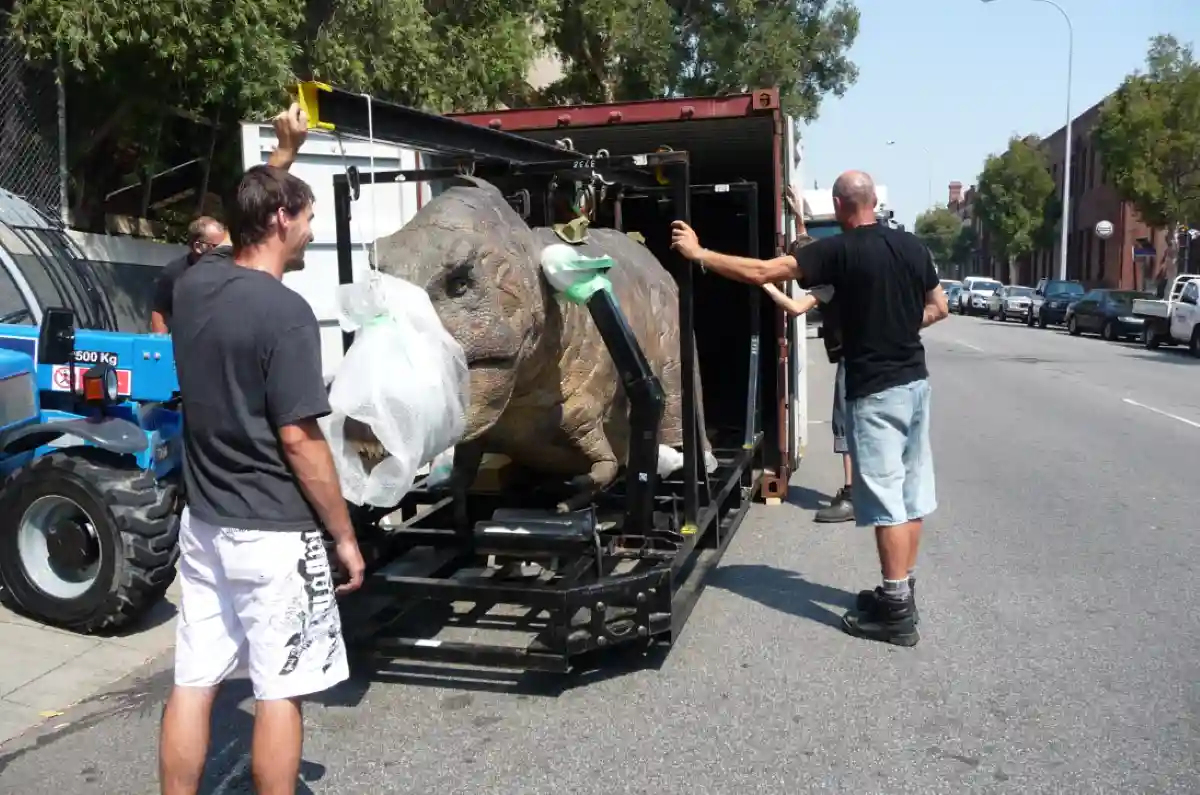
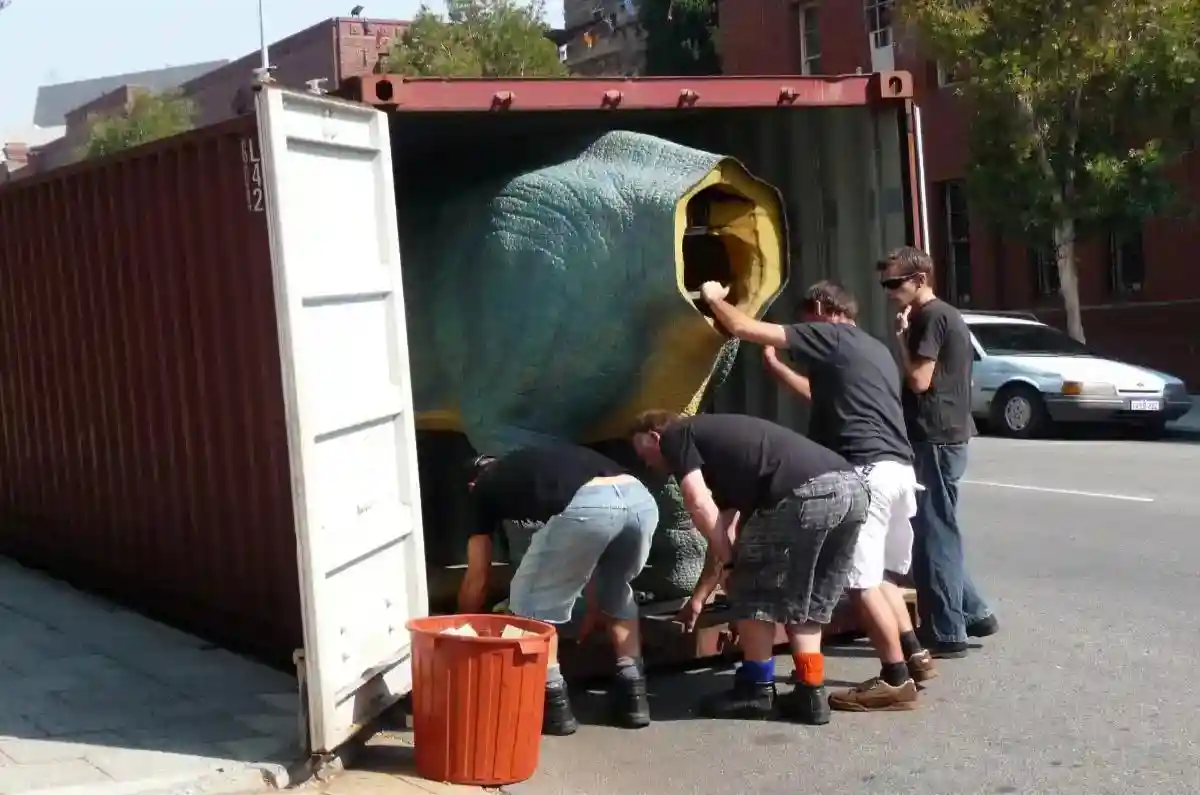
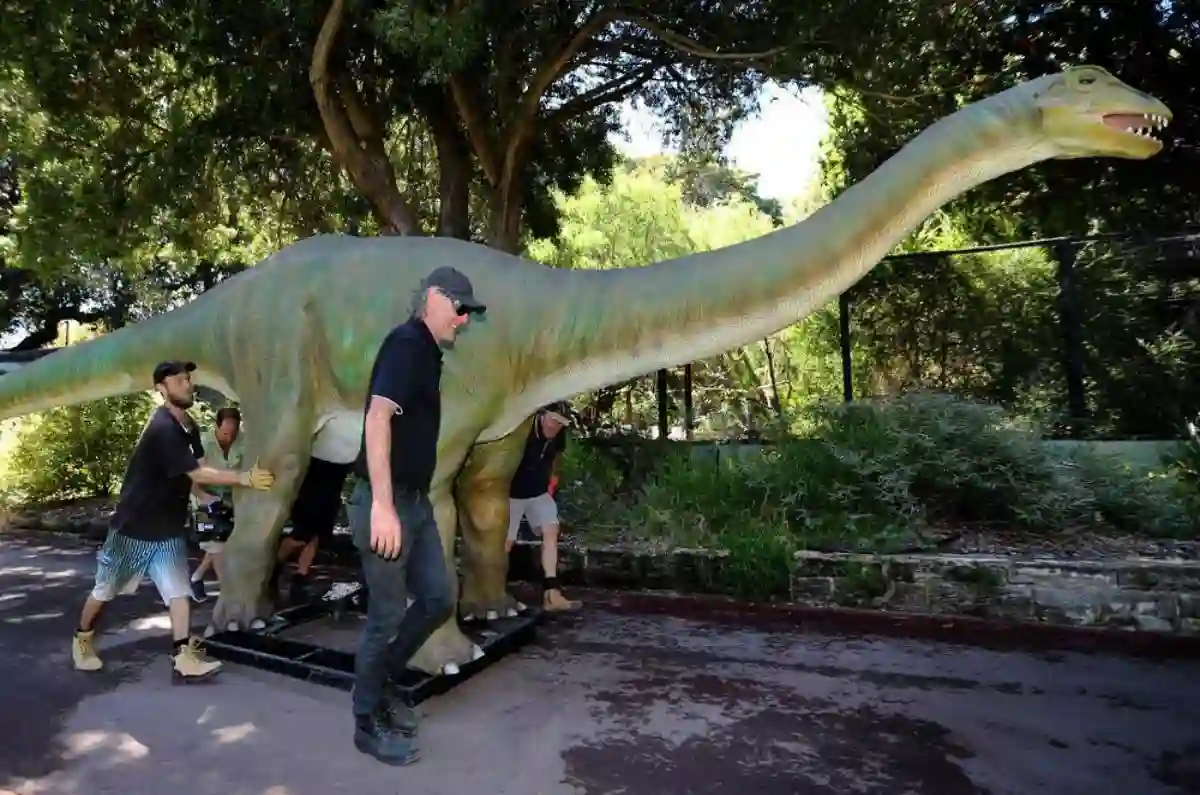
Case Snapshot — Medium-Scale Outdoor Park (Australia)
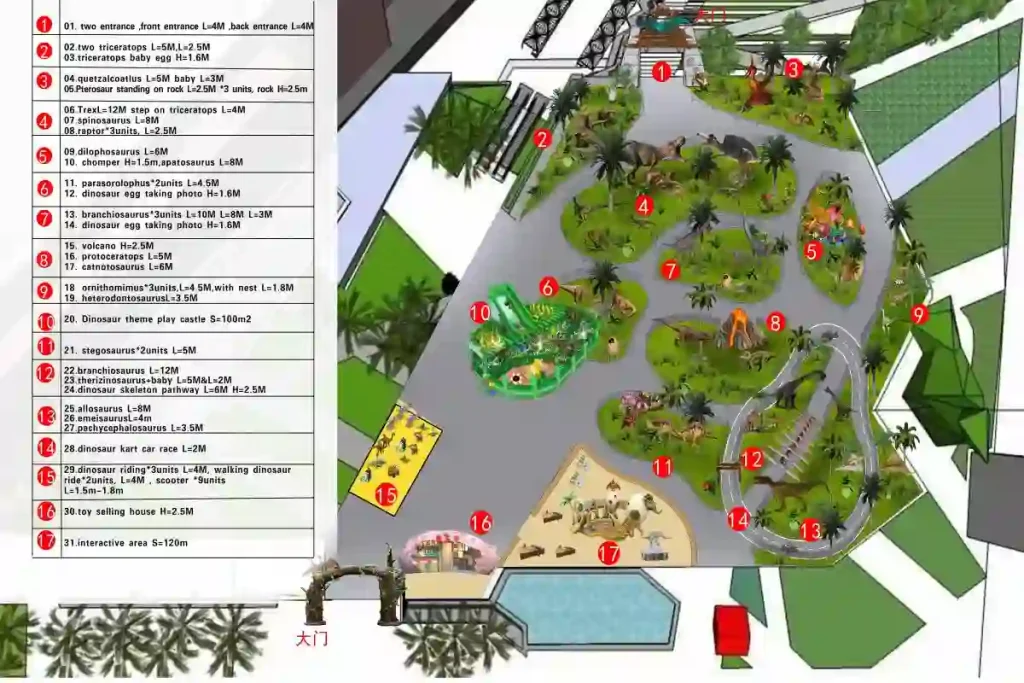
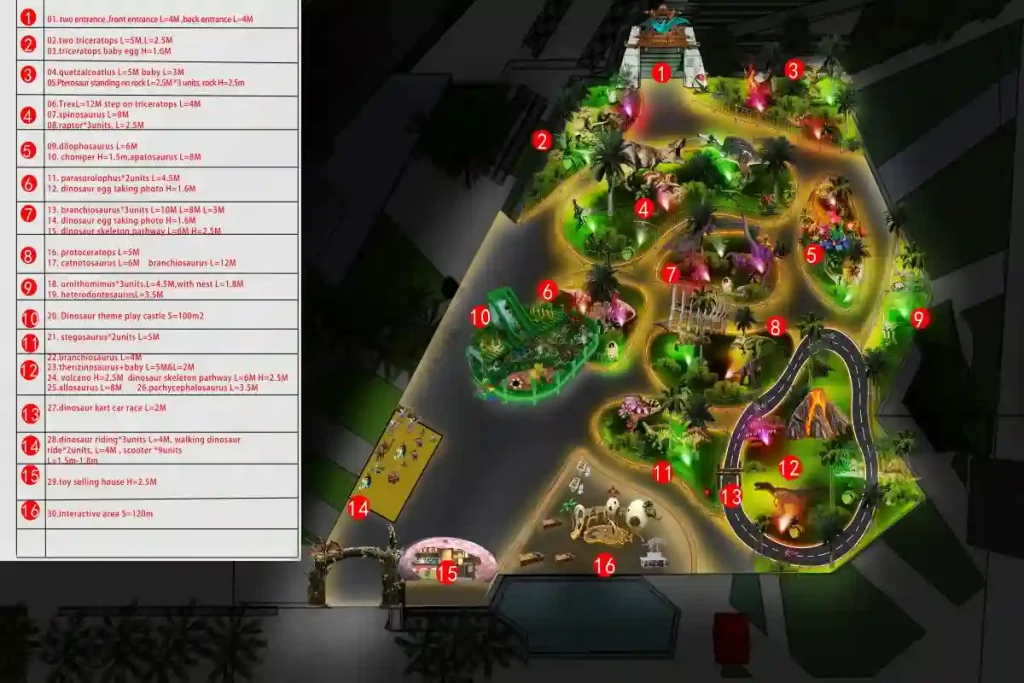
A compact-site project demonstrating circulation efficiency, immersive density, and compliance-driven execution.
📐
Site Planning
4,000 m² outdoor site, maximizing space and avoiding congestion.
🦖
Asset Strategy
17 interactive elements balancing visual impact, engagement, and throughput.
🚶
Visitor Circulation
500+ m one-way trail designed for safe, smooth visitor flow.
🎟
Market Positioning
AU$20–30 ticket range for cities of 1 million+ population, aligned with family leisure spending.
🛠
Compliance & Delivery
Built to Australian safety standards, reducing approval risk.
Note: Note: To protect the commercial exclusivity of our partners, specific project names, locations, and exact animatronic dinosaur exhibition cost data are shared only under NDA.
Important Note & Disclaimer
The investment and ROI figures presented on this page are industry-reference ranges, derived from:
- Authoritative Market Inputs: IAAPA global attraction benchmarks, TEA/AECOM Theme Index visitor volume patterns, UNWTO tourism traffic models, Euromonitor regional tourism growth data, national tourism boards & museum authorities (EU, AU, ASEAN, LATAM).
- Industry-Wide Pricing & ROI Samples: Public supplier pricing from Asia, EU, US (2019–2024), cost structures from museum, park, FEC, municipal projects, investment-return patterns from 30+ countries.
- Sanhe Internal Project Insights: global animatronic deliveries, real visitor-feedback loops, operation cost modeling (maintenance, downtime, visitor flow).
Disclaimer: These numbers are not official standards and do not constitute a financial commitment. Actual performance may vary depending on venue type, ticket strategy, seasonal traffic, and asset scale.
Receive a Tailored Concept & Budget Range
Submit your venue information (type, size, theme direction) and receive a tailored concept and budget within 24–48 hours, including preliminary theme direction, options for creature scale, interaction level, and scene immersion.